
What the Analytics dashboard shows
What your visitors did with your filters, and where to read it.
In short
Analytics is one screen under Category Filter in the admin menu. Two controls at the top scope everything below it - which filter, and over what period. Three cards give you the headline numbers, a chart shows the trend, and a panel underneath holds the detail in three tabs. There's no export, so this screen is where the data lives.
Getting there
Category Filter → Analytics in the WordPress admin menu. Nothing appears until a filter has been recording - that's the Enable switch described on Analytics settings, set per filter.
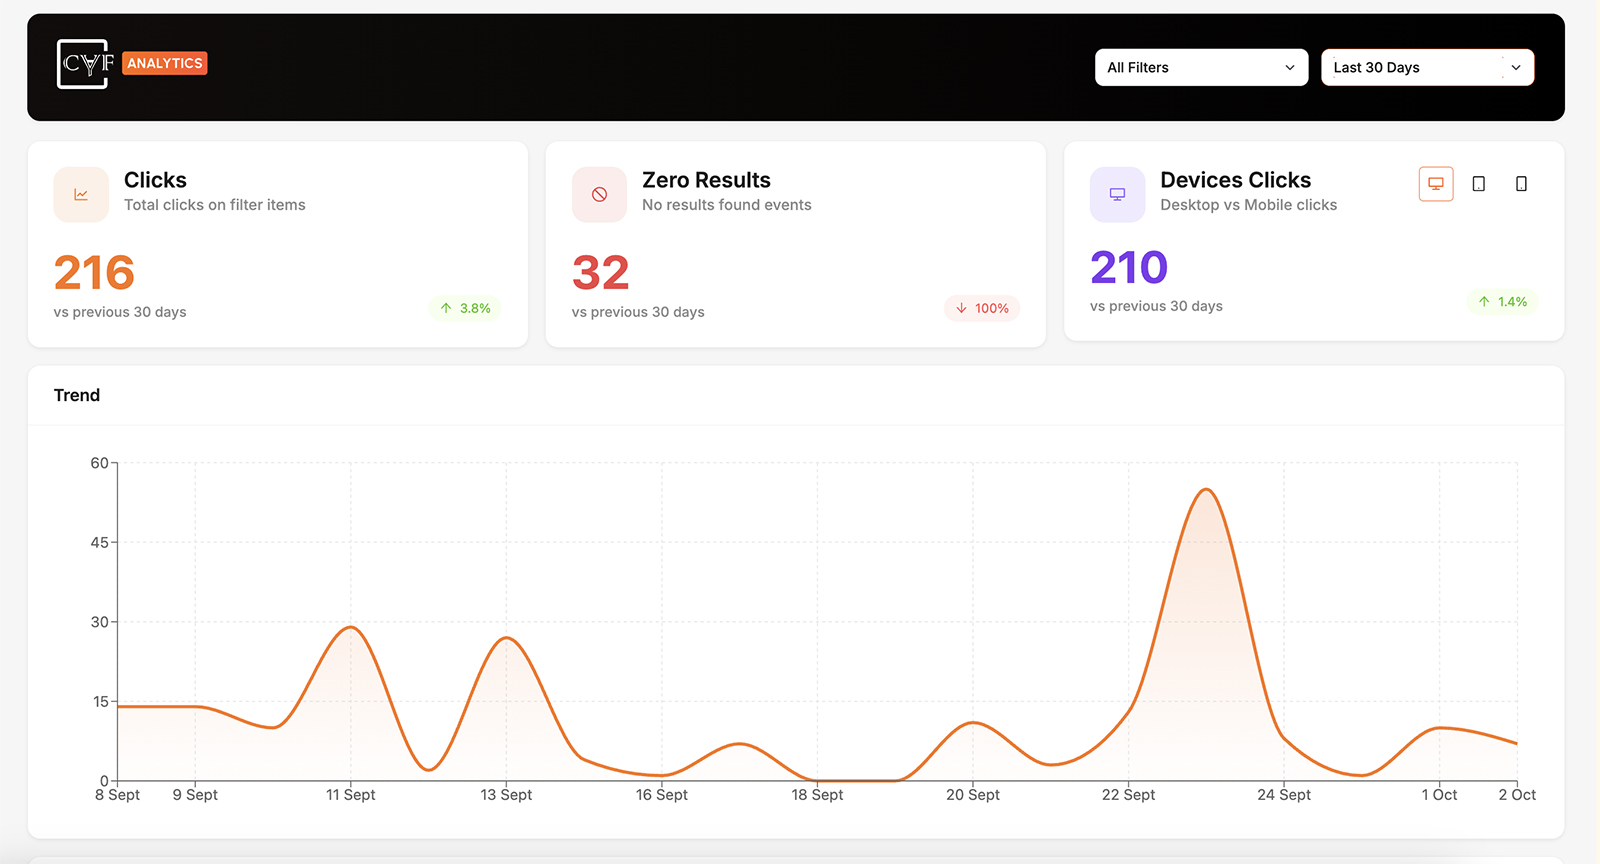
One screen: scope at the top, headline numbers, trend, and the detail below.
Choosing what you're looking at
Two dropdowns sit in the header, and everything on the screen answers to them.
| Control | What it does |
|---|---|
| Filter | Which filter's data you're seeing. All Filters combines them; choosing one narrows it to it. Only filters with analytics switched on appear in the list. |
| Date range | Today, Last 7 Days, Last 30 Days or All Time. |
Comparing one filter against another is worth doing early. A filter that gets far fewer clicks than the rest usually isn't underperforming - it's badly placed, or offering choices nobody wants.
The three cards
| Card | What it counts |
|---|---|
| Clicks | Total clicks on filter items over the period. |
| Zero Results | How many times a visitor's selection returned nothing. |
| Devices Clicks | Clicks by device. The three icons on the card switch the figure between desktop, tablet and mobile. |
Each card also shows the change against the previous period of the same length, so a seven-day view compares against the seven days before it. That comparison is usually more useful than the number itself - a count means little in isolation, but a sharp move in either direction is worth understanding.
Zero Results is the one to watch. Clicks going up is good news you can do nothing with; zero results going up is a problem with a cause you can find.
Trend
The chart plots activity across the period you've chosen, so you can see whether a total came from steady use or from one busy day. Spikes usually have an explanation outside the plugin - a campaign, a mention somewhere, a product going live - and knowing which day to look at is what makes the rest of the data readable.
Insights & Search Data
Underneath sits the detail, in three tabs. The cards tell you how much; these tell you what.
| Tab | What it shows |
|---|---|
| Top Terms | The filter terms visitors chose most, each with the taxonomy or field it came from. |
| All Searches | What people typed, with the average number of results each search returned. |
| Zero Results | The searches and filter combinations that found nothing. |
Reset analytics data
A button at the foot of the screen clears the stored data.

Careful
This deletes everything, not just what's on screen. Every analytics row the plugin holds goes - raw events, daily rollups, term-level summaries and search-keyword aggregates, across all filters and all layouts, whatever the header is scoped to. It can't be undone, and there's no export, so nothing is recoverable afterwards. Your filters, layouts and analytics settings are untouched; only the recorded data is destroyed.

Note
There's no export from this screen. If a figure matters to you beyond this session - a monthly total, a list of failed searches to work through - write it down or screenshot it before it scrolls out of your date range.
Common Questions
The screen is empty.
Nothing has been recorded yet. Analytics is switched on per filter in that filter's Global Settings, and there's nothing to show until a filter with it enabled has had some front-end use.
One of my filters isn't in the dropdown.
Only filters with analytics switched on appear. Enable it in that filter's settings.
How far back can I look?
Today, the last 7 days, the last 30 days, or all time.
What does the percentage under each number mean?
The change against the previous period of the same length.
How do I see mobile clicks separately?
Use the device icons on the Devices Clicks card.
Does Reset only clear what I'm looking at?
No. It deletes all stored analytics data for the plugin, across every filter and date. There's no undo and no export.
Can I export the data?
No - the screen is the only place it exists.
Was this page helpful?
Thanks for your feedback!